Mapping Family Structure with the Genogram: A Minuchin-Informed Guide to Boundaries and Hierarchy
Turn a static genogram into a living structural map. A clinician's guide to visualizing boundaries, hierarchy, and coalitions using Minuchin's lens.
Key takeaway
In Salvador Minuchin's structural family therapy, presenting problems stem from flaws in family structure rather than individual pathology, and the clinician's task is to read and reorganize that structure. From this lens, a genogram should function not as a static information sheet but as a structural map that makes boundaries, hierarchy, and coalitions visible. Boundaries fall into three types—clear, rigid, and diffuse—each drawn with a distinct line style and spatial arrangement. Pairing enactment, spatial positioning, and circular questioning lets you capture complex dynamics like triangulation and detouring, so you can pinpoint exactly where to intervene.
Drawing More Than a Family Tree: Visualizing Hidden Dynamics Through Minuchin's Lens
If you work with families, you already know the session room can feel like a crucible of moving parts. A mother who interjects every time the father speaks. A child who falls silent the moment the parents start to argue. A grandparent who steps so far into a grandchild's upbringing that the parents quietly recede. Inside that swirl, our job is to understand how the family system actually operates.
A basic genogram—squares, circles, and the lines that connect them—captures who is related to whom. But it struggles to hold the psychological dynamics that make family work so demanding. This is exactly where Salvador Minuchin's structural family therapy becomes a clinical asset. Making a family's boundaries and hierarchy visible gives us a compass for setting treatment goals and choosing where to intervene.
This article looks at how we can upgrade the genogram from a record-keeping form into a living clinical instrument—and how to capture the structural details that are easy to miss in the moment.
The Core of Structural Assessment: Making Invisible Lines Visible
Minuchin located the source of family problems not in the pathology of any one member, but in flaws in the family's structure. The therapist's task, then, is to read that structure and help reorganize it. Used this way, the genogram stops being an information sheet and becomes a structural map of the family.
1. A Qualitative Reading of Boundaries
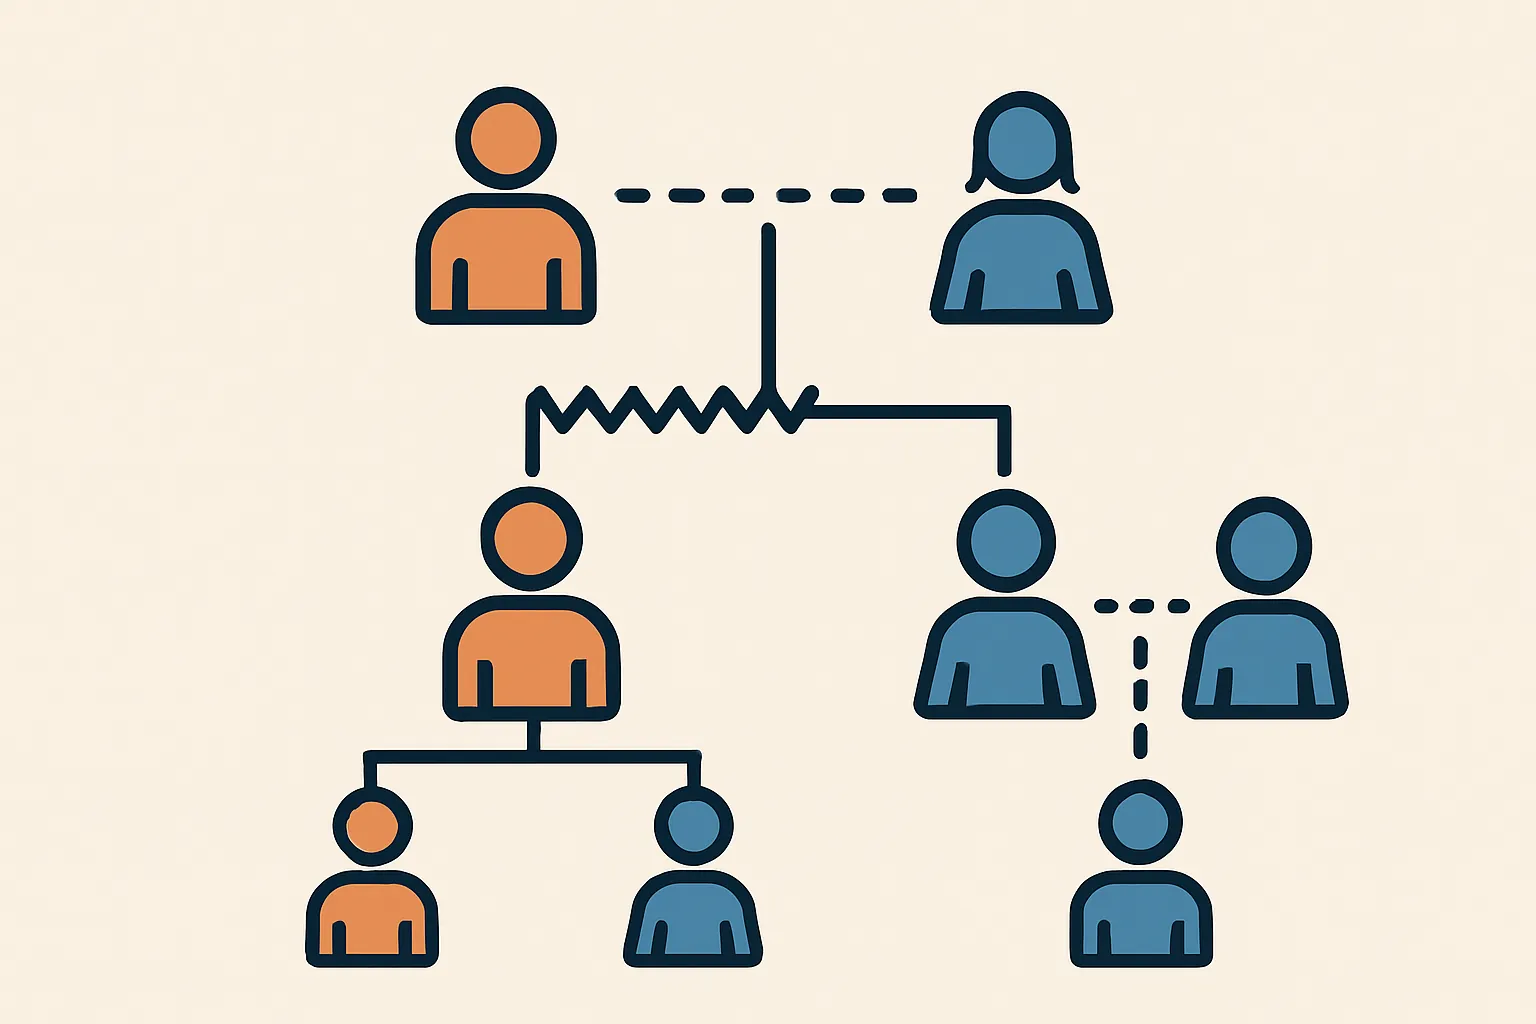
Boundaries define how subsystems contact one another, and how the family contacts the outside world. When you draw a genogram, go beyond a single connecting line and let the line style itself convey the quality of the relationship. If a mother-son bond is so enmeshed that it crowds the father out, draw that dyad with a triple line (overinvolvement) and the marital dyad with a dashed line (distance) or a jagged line (conflict). The picture should be readable at a glance.
2. Locating Hierarchy and Power
In a functional family, the parental subsystem sits above the sibling subsystem and holds appropriate authority. In struggling families, that hierarchy is often eroded or inverted. When a parental child has taken on an adult role, or a grandparent overrides parental authority, mark it explicitly—through vertical placement, relative size, or directional arrows on the map.
3. Alignments and Coalitions
Who sides with whom? This is the heart of family politics. Distinguishing a coalition (two members joining against a third) from a simple alignment (an emotionally close pair) gives you decisive clues for planning interventions such as joining or unbalancing.
When you classify a family, drawing clear distinctions between boundary types is essential. The table below summarizes the boundary patterns you'll meet most often, the family climate each tends to produce, and what to note as you build the map.
| Boundary Type | Clinical Picture (Family Climate) | Common Symptoms & Problems | Mapping Notes |
|---|---|---|---|
| Clear Boundary | Autonomy and connection are balanced; communication flows and members support one another. | A healthy, functional family that keeps its resilience under stress. | Connect members with a solid line (—); parent–child hierarchy is well defined. |
| Rigid Boundary | A disengaged family; little emotional exchange and excessive independence. | Difficulty asking for help and a sense of isolation; with an acting-out adolescent, parents notice late. | Connect members with a dashed line (- - -); place subsystems far apart. |
| Diffuse Boundary | An enmeshed family; intrusive overinvolvement that erodes autonomy. | Psychosomatic presentations (e.g., anorexia); one member's problem instantly spreads to the whole family. | Use a dotted line (····) or doubled line (≡); draw members overlapping or very close. |
Boundary types and visualization guide, from a structural family therapy perspective.
Practical Strategies That Sharpen Clinical Insight
To move from theory to the session room and make the genogram more precise, here are concrete strategies you can put to work.
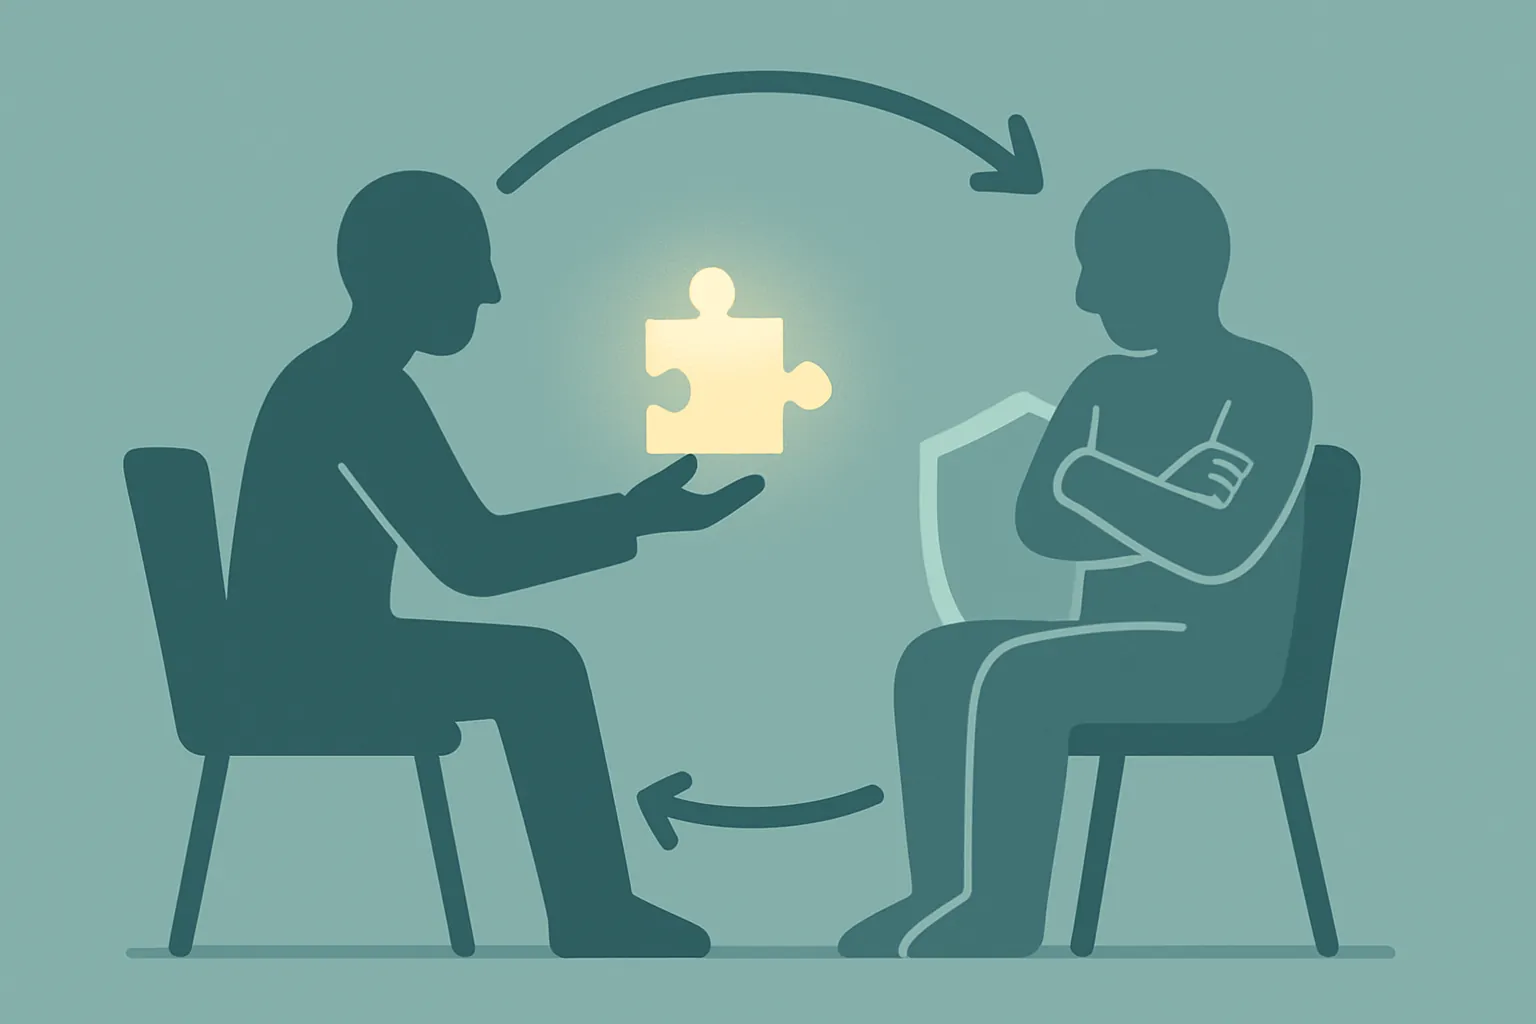
1. Map the Room with Enactment
Drawing a genogram from what clients say alone can give you distorted data. Watch how the family actually interacts in front of you. Invite an enactment—"Would you say that directly to your mother?"—and observe who cuts off whom, who looks at whom, and update the interaction lines on your map in real time. This is precisely the present-moment interaction Minuchin emphasized.
2. Let Spatial Positioning Inform the Map
Where people choose to sit reflects the family's structure. If the father takes a corner while the mother and son settle side by side, you're likely seeing a disengaged father and an enmeshed mother-son dyad. As you draw, place physically close members close together and psychologically distant members far apart—use the spatial metaphor deliberately. It becomes a powerful visual aid when you later show the map back to the family during a confrontation.
3. Trace Relationships with Circular Questions
Ask circular questions: "When your father gets angry, what does your mother do?" "When the younger one cries, how does the older one respond?" These reveal not only the A–B relationship but the role of C in shaping it. From there you can move past simple linear links and capture more complex dynamics—triangulation or detouring—marking them on the map as a triangle or a detour path.
Conclusion: Precise Mapping Drives Therapeutic Change
Building a genogram through Minuchin's structural lens is not clerical work—it's drafting the blueprint for treatment. By making boundaries, hierarchy, and coalitions visible, you keep your bearings inside the family's chaotic dynamics and pinpoint where intervention belongs. Whether a family system can change depends in large part on how clearly the clinician can see its structure.
That said, in multi-person family sessions, tracking and recording every subtle verbal and nonverbal exchange in real time is genuinely taxing. When you're relying on memory for who interrupted whom, or exactly what words were exchanged in a heated moment, important structural clues slip away.
This is where careful documentation practices—and, increasingly, secure transcription support—earn their place. A faithful session transcript lets you reconstruct conversational share, turn-taking, and interruption patterns objectively, which is invaluable when you revisit a case in supervision or case analysis. Freed from the burden of recording every word, you can give your full attention to a client's gaze and gestures while you build the structural map in your head. Modalia AI is designed as a security-first partner for exactly this kind of work—transcription, case conceptualization, and documentation support—so technology stays in the background and your clinical insight stays in the foreground.
FAQ
References
- 1.
Frequently asked questions
How is a structural map different from a standard genogram?
A standard genogram records who is related to whom. A structural map, in Minuchin's tradition, layers in the quality and function of those relationships—boundary types, hierarchy, and coalitions—using line styles, spatial placement, and arrows so you can see at a glance where the system is strained.
How do I represent the three boundary types visually?
Use a solid line for clear boundaries, a dashed line for rigid (disengaged) boundaries, and a dotted or doubled line for diffuse (enmeshed) boundaries. Reinforce the line style with spatial distance—place disengaged members far apart and enmeshed members overlapping or very close.
What is the difference between an alignment and a coalition?
An alignment is simply an emotionally close pair. A coalition is two members joining forces against a third. The distinction matters clinically because coalitions—especially cross-generational ones—often signal where to intervene with joining or unbalancing techniques.
How can I capture structure beyond what clients report verbally?
Combine three methods: enactment (observe live interaction in the room), spatial positioning (note who sits where), and circular questioning (ask how one member responds to another's behavior). Together these surface triangulation, detouring, and other dynamics that self-report alone tends to miss.
This article was written and reviewed using Modalia AI's clinical guidelines, with professional human review before publication.
Related articles
 Case Conceptualization
Breaking the "Yes, But" Game: A Transactional Analysis Guide for Therapists
Every suggestion you offer gets met with "Yes, but..." Here's the TA structure behind that stall—and four clinical moves to break it.
7 min read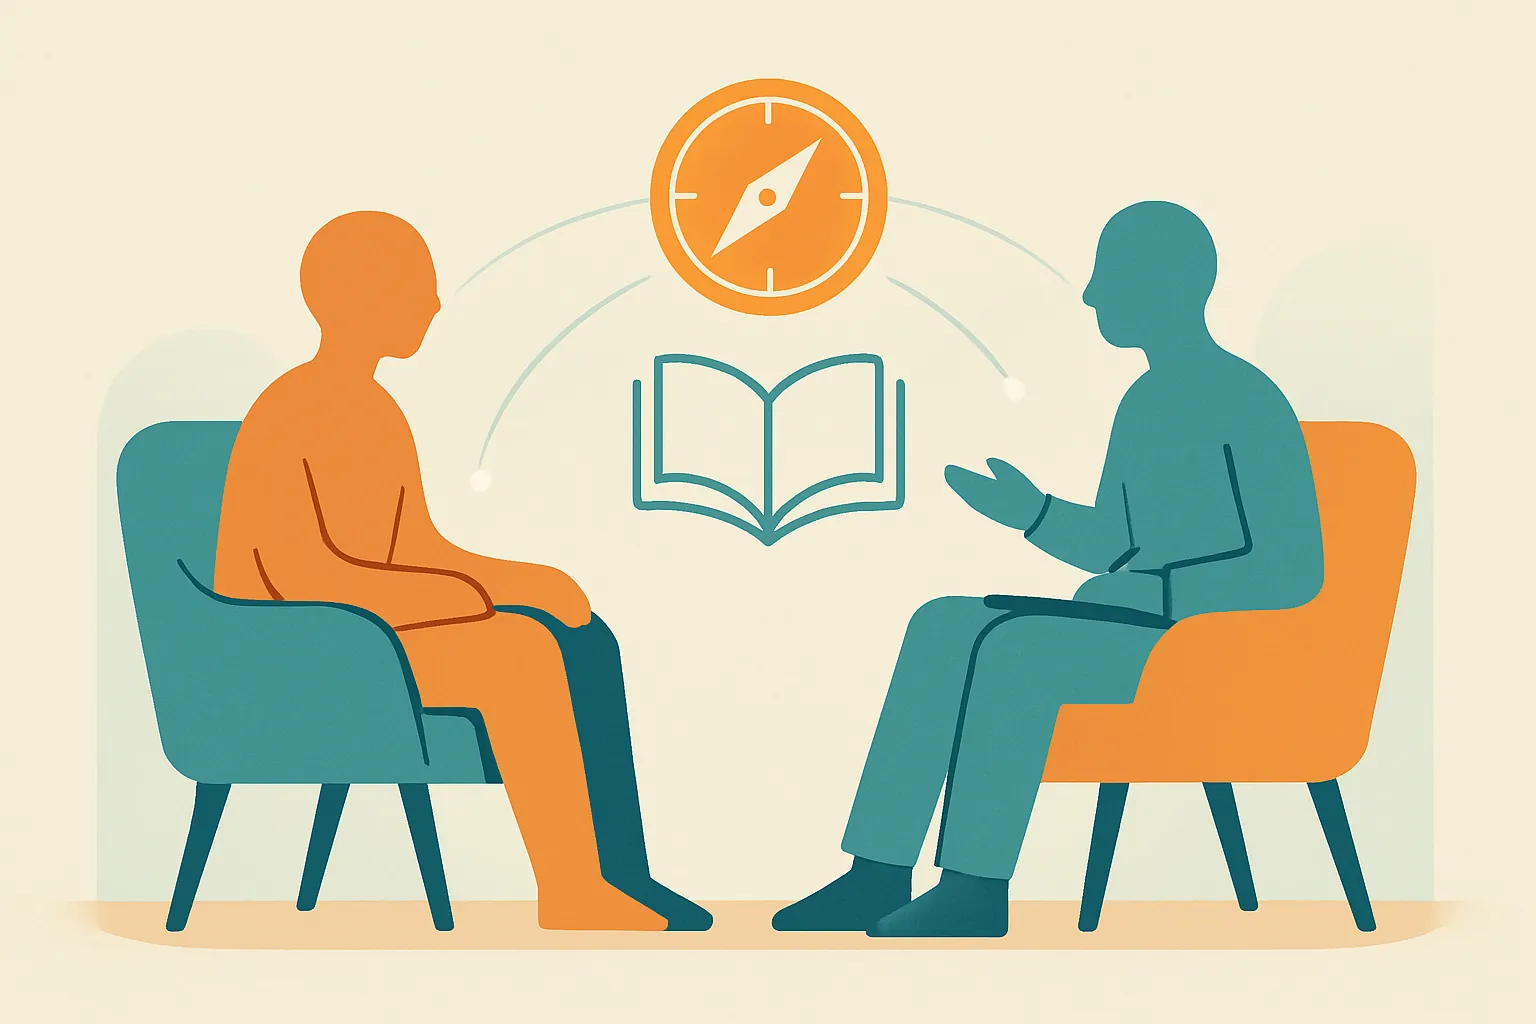 Case Conceptualization
Yalom's The Gift of Therapy: Passages Every New Counselor Should Copy by Hand
Irvin Yalom's prescription for therapists who fear silence: meet your client as a "fellow traveler" and let the here-and-now become the heart of the work.
6 min read Case Conceptualization
Working With Silence in Therapy: What Client Silence Means and How to Hold It
Silence in session isn't empty space. Learn to read its clinical meaning, tell productive from defensive silence, and use it as a therapeutic tool.
6 min read